I’m continuing to work with my web host (Site5) to figure out why my VPS (virtual private server) which hosts all my WordPress websites has been crashing pretty regularly. This has been happening the past week with unfortunate frequency when I tweet-out a link to a new blog post. I’ve had different issues with web server loads in the past on my WordPress sites, and installed/used some different “caching” plugins to address them. In this post I’ll share what I’m doing at this point to try and address server load issues and also the LARGE discrepancy I’ve found between the website statistics of CloudFlare versus Google Analytics.
As I’ve addressed in previous posts, caching plugins are important for busy WordPress sites because they can serve up “static” webpages which don’t trigger or require PHP and mySQL database code execution on your web host. This means more webpages can be served to more visitors with less server power being needed/required. The proliferation of spam bots, web crawlers, and other kinds of automated computer programs accessing webpages on the Internet has significantly increased in the past few years. Free services like Google Analytics which count page views and unique web visitors have algorithms and techniques which attempt to remove website “hits” / accesses by bots and crawlers, so they reflect “just the humans” who are visiting different websites. Google Analytics is just one way to measure web traffic, however.
According to the English WikiPedia, CloudFlare is:
…a company which provides a content delivery network and distributed domain name server, sitting between the visitor and the CloudFlare user’s hosting provider, thus acting as a reverse proxy for websites. The service provides security, as well as improving website performance and speed. CloudFlare protects, speeds up, and improves availability for a website or mobile application with a simple change in DNS.
Several months ago, my web host started offering FREE integration of CloudFlare’s services with just a few clicks. The changes this has made in the serving of webpages from my primary blog (this site: speedofcreativity.org) has been pretty transparent to me. The only time I’d notice CloudFlare was working was when my server crashed, and a CloudFlare error message would eventually be displayed in my browser. CloudFlare HAS been hard at work protecting my site, serving webpages and saving my web host quite a bit of bandwidth, and this evening I looked at my CloudFlare website statistics for the first time. What I found is so out of line with my Google Analytics statistics that I initially thought they had to be a mistake. After further research, however, I think they are correct and reflect a more accurate picture of website accesses/hits on my sites.
Before I share some screenshots of those comparative statistics, I’ll share the main WordPress plugins I’ve been using and trying to reduce my server load and stop these crashes. These are all free plugins.
- WP Super Cache is much easier to configure compared to W3 Total Cache and is effective in reducing server load
- WP-Cron Control stops automatic CRON requests from running on your server every time a web visitor requests a page. After enabling it, however, it’s necessary to configure a “custom CRON job” in your CPANEL, which is a geekier task than typical WordPress configuration changes. My web host helped me configure this properly.
- WordFence Security blocks malicious website attackers, and can also scan a WordPress site for malware. (I’ve also experimented with iThemes Security for this, but because of the large size of my primary blog it overwhelmed my hosting server.)
- Bad Behavior identifies and blocks spambots and can use the database from Project Honeypot to block IP addresses from known “bad guys.” I used Bad Behavior years ago (in the late 1990s) to stop blog spam, but hadn’t used it since. It’s a newer plugin I’m just starting to use and hope it will help in this struggle.
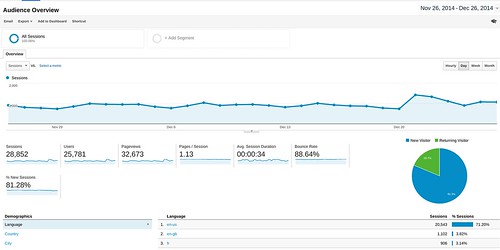
Based on Google Analytics, I’ve been thinking that my speedofcreativity.org website has been getting around 30K to 40K visitors per month. This is a screenshot of the past 30 days of Google Analytics for my site, which shows over 27K visitors and over 32K page views.
These statistics are roughly equivalent to those generated by WordPress.com via the free JetPack plugin. This screenshot shows monthly visitors hovering around 30K. I re-enabled statistics this past August, and hadn’t had them enabled since a year ago in December 2013.
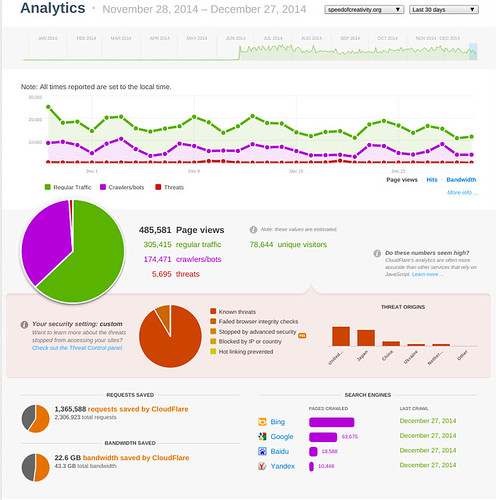
These statistics are HUGELY different from those CloudFlare is reporting. According to CloudFlare, my website had over 485K pageviews in the past 30 days, and over 78K unique visitors. CloudFlare also breaks down how much of this was “regular traffic” and how much was “crawlers/bots.” As you can see, bot traffic is HUGE today. CloudFlare also identifies traffic that are “threats,” meaning (I think) they attempt to inject malware / harmful code into websites.
I did a bit of research about these glaring differences between Google Analytics and CloudFlare, since I’m sure many other folks have seen this kind of thing before me. The most interesting sentences in CloudFlare’s 2011 post, “Understanding Analytics: When Is a Page View Not a Page View?” are:
CloudFlare follows the same industry standard [as Facebook] and so our reported page views is usually higher than what you’re see in Google Analytics. This is especially pronounced for AJAX-driven sites. This doesn’t mean you can go to your advertisers and start demanding more ad revenue. It should, however, mean that you now have a more accurate picture into the actual resource demands required to run your site.
Based on my relatively shallow understanding of Google Analytics, I’ve understood that bot/crawler traffic accounted for a lot of the load on my web server hosting account. I had no idea, however, the numbers and statistics for my monthly web traffic were/are this huge.
If you have any insights into this or suggestions for more steps I could take (besides paying for a higher tier VPS with more RAM and server power) to address these issues, I’d love to hear them. Probably not coincidentally, this most recent bout of server load problems started about a week ago when I finally moved the WordPress site for the K-12 Online Conference (k12onlineconference.org) from the EduBlogs servers (where it has been generously hosted for free since 2006) to my own VPS. My web host tech support team has reported a lot of malicious traffic to the k12online site, and I’ve taken the same steps I took with my speedofcreativity site (turning on CloudFlare, installing the previously mentioned plugins) to try and address those problems.
One thing I’d love to see is which of my 30+ WordPress sites are triggering the biggest server load at any particular time, so I can focus on them. My web host told me a way to check the top memory using sites using CPANEL’s terminal (use the command “top”) but I also learned that a Google Chromebook can’t run the embedded Java program CPANEL uses. That’s something I’ll have to try later. Troubleshooting this situation is challenging because the server load situation is opaque to me unless my web host tech team shares a report with me via a trouble ticket.
This is definitely more “in the weeds” technical troubleshooting than I want to do. I’m hopeful a resolution will emerge soon that will stabilize things so I won’t have to dedicate so much attention and so many heartbeats to these issues.
If you enjoyed this post and found it useful, subscribe to Wes’ free newsletter. Check out Wes’ video tutorial library, “Playing with Media.” Information about more ways to learn with Dr. Wesley Fryer are available on wesfryer.com/after.
On this day..
- Student Voice, YouTube, & Digital Citizenship: Rachel Fryer on the TEDx Stage – 2016
- Fantastic Questions for Student Learning Reflections – 2015
- Join Our Google Hangout Today: 2014 EdTech Year in Review – 2014
- Holiday iPhone and iPod Touch Application Pruning – 2009
- An Oklahoma City to Kansas City Amtrak Connection may be coming! – 2008
- More lessons learned on iPod video conversion – 2006
- Top web 2.0 priorities for 2007 – 2006
- More intelligent web on the way – 2006
- Classroom Audio Podcasting – 2005
- Great Prime Rib! – 2005


Comments
2 responses to “Comparing Differences in Website Statistics Between CloudFlare and Google Analytics”
I can think of a few options:
1. Move to a SSD based VPS (my current favorite is Digital Ocean. All SSD and they have a ton of tutorials at https://www.digitalocean.com/community).
2. Spin up another VPS and move MySQL to it. Put a bunch of memory in it and optimize MySQL so that it can cache most queries to memory.
3. Set up a Varnish cache in front of your webserver, optimized for WordPress sites (http://publishingwithwordpress.com/installing-varnish/)
4. Move to WordPress.com.
You may be able to see what sites are hitting your DB by using MySQLWorkbench (http://www.mysql.com/products/workbench/) It shows all sorts of cool stuff.
Thanks for these great suggestions, Ryan. I seem to have worked things out by turning off half the plugins I was running on my site (I was using over 20) and mainly by installing WordPress Quick Cache:
https://wordpress.org/plugins/quick-cache/
For a couple days now I’ve been able to post and haven’t had my VPS go down, so at this point I think I’m good! I’m glad to know about the other options you mentioned, however, I hadn’t considered or known about those. I think I used MySQLWorkBench awhile back when I had to migrate my sites to another server, but I didn’t realize it showed metrics. That could be a BIG help, since the biggest challenge of this has been NOT having direct access to any stats on server load / utilization.