
These are my notes from Margaret Shaw Chernosky’s presentation, “Visualizing Data in Google Earth” at the September 26, 2011, Google Geo-Teacher Institute in Lewiston, Maine.
MotionX-GPS app for iPhone: creates Google Earth KML/KMZ file with your speed/location as you travel
Bring live hurricane and tropical storm data into your classroom via KML/KMZ files: www.nhc.noaa.gov/gis/
Bring live earthquake data in KMZ format from NOAA: earthquake.usgs.gov/earthquakes/catalogs/
Get local: Google Earth KML/KMZ data files for Maine: www.maine.gov/megis/catalog/
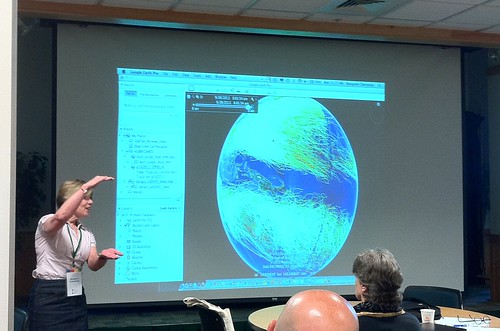
Margaret showing aggregated hurricane / tropical storm tracks in Google Earth, asking, “Where AREN’T there hurricanes?”
Some Pasco sensors have GPS included, so as you paddle down a river and take a water sample the GPS coordinates are also recorded with your data
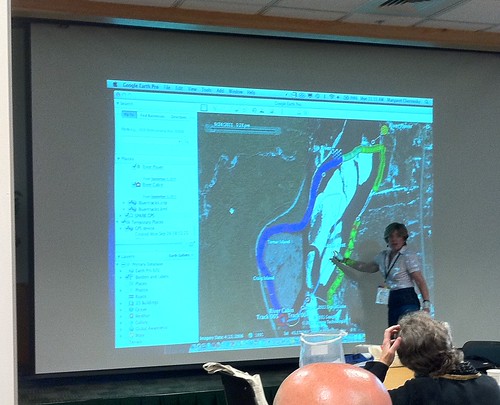
Google Earth Pro can not only handle global data, but also large quantities of data you collect with your students about your LOCAL area
Margaret used a Pasco sensor to measure water temperatures in her Kayak, and was showing us here how that can be visualized in Google Earth Pro
Google Earth Pro costs $400 per year for a license, but educators can get it free
Technorati Tags: earth, gct, google, visualize, gti2011
If you enjoyed this post and found it useful, subscribe to Wes’ free newsletter. Check out Wes’ video tutorial library, “Playing with Media.” Information about more ways to learn with Dr. Wesley Fryer are available on wesfryer.com/after.
On this day..
- Digital Literacy Tips: Strategies for Online Fact Checking – 2016
- Four Upcoming iPad Digital Storytelling Workshops in Oklahoma – 2013
- Oklahoma Innovation Task Force Education Survey – 2013
- Common Core Writing Lesson With AudioBoo: 9/11 Narrated Art – 2012
- A Google Geo-Teacher Learning Day Story: In Tweets – 2011
- Google Earth and Google Maps GTI Workshop (Sep 2011) – 2011
- Google Fusion Tables: Geo-spatially connecting database data – 2011
- Digital Grounding and loss of Facebook Privileges – 2010
- Follow tonight’s Presidential debate on OETA’s Political Pulse Blog – 2008
- CamTwist worked today for our webcast! – 2008