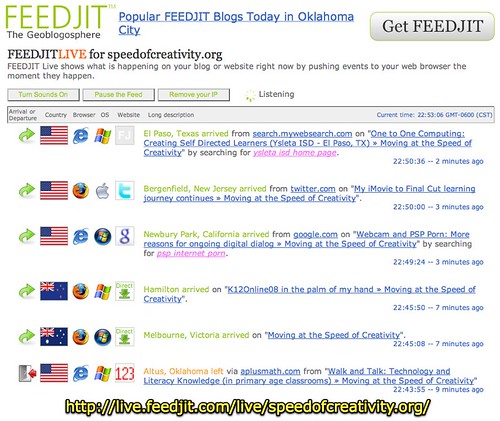
ClustrMaps and feedjit.com continue to be my two favorite tools for tracking website visitors. Feedjit provides real-time visitor tracking showing not only the countries associated with web visitors’ IP addresses, but also the web browser, computer operating system, and search site the visitor used (if any) to link to your website. If a search query was used, that is also shown.
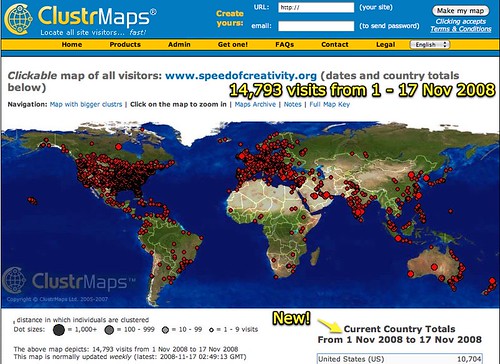
ClustrMaps shows a graphical geographic distribution of website visitors, which (since I pay for a “plus” account) is clickable to enlarge each continent individually. ClustrMaps (which I’ve snapped to Flickr fairly often in the past few years) never cease to amaze and humble me.
Tonight I noticed ClustrMaps has added a new feature: textual lists of “Current Country Totals” for a particular website. This is a different presentation of geographic web visitor data from that previously presented by either Feedjit or ClustrMaps.
United States (US) 10,704
Canada (CA) 765
United Kingdom (GB) 661
Australia (AU) 366
India (IN) 161
Germany (DE) 128
New Zealand (NZ) 104
Philippines (PH) 98
Netherlands (NL) 92
Singapore (SG) 83
China (CN) 69
France (FR) 69
Italy (IT) 67
Spain (ES) 64
Brazil (BR) 58
Thailand (TH) 57
Norway (NO) 53
Malaysia (MY) 51
Sweden (SE) 50
Mexico (MX) 50
Turkey (TR) 48
Ireland (IE) 42
Poland (PL) 41
Indonesia (ID) 40
Korea, Republic of (KR) 37
Denmark (DK) 34
Hong Kong (HK) 34
Belgium (BE) 34
Japan (JP) 32
Switzerland (CH) 32
Greece (GR) 31
Romania (RO) 30
United Arab Emirates (AE) 30
Taiwan (TW) 28
Pakistan (PK) 28
South Africa (ZA) 25
Portugal (PT) 25
Israel (IL) 21
Russian Federation (RU) 20
Czech Republic (CZ) 20
Saudi Arabia (SA) 20
Finland (FI) 20
Egypt (EG) 18
Europe (EU) 17
Bulgaria (BG) 17
Colombia (CO) 16
Austria (AT) 16
Hungary (HU) 14
Argentina (AR) 13
Slovakia (SK) 13
Vietnam (VN) 13
Iran, Islamic Republic of (IR) 13
Puerto Rico (PR) 12
Slovenia (SI) 11
Trinidad and Tobago (TT) 11
Qatar (QA) 10
Venezuela (VE) 10
Jamaica (JM) 10
Chile (CL) 9
Ecuador (EC) 9
Morocco (MA) 9
Lithuania (LT) 8
Serbia (RS) 7
Cyprus (CY) 7
Peru (PE) 6
Kuwait (KW) 6
Bahrain (BH) 6
Oman (OM) 6
Latvia (LV) 6
Croatia (HR) 6
Kenya (KE) 5
Costa Rica (CR) 5
Estonia (EE) 5
Ukraine (UA) 4
Sudan (SD) 4
Bangladesh (BD) 4
Iceland (IS) 4
El Salvador (SV) 3
Panama (PA) 3
Guam (GU) 3
Azerbaijan (AZ) 3
Bosnia and Herzegovina (BA) 3
Honduras (HN) 3
Virgin Islands, U.S. (VI) 3
Nigeria (NG) 3
Brunei Darussalam (BN) 3
Belarus (BY) 3
Barbados (BB) 3
Uruguay (UY) 2
Tanzania, United Republic of (TZ) 2
Swaziland (SZ) 2
Sri Lanka (LK) 2
Moldova, Republic of (MD) 2
Macedonia (MK) 2
Syrian Arab Republic (SY) 2
Dominica (DM) 2
Palestinian Territory (PS) 2
Tunisia (TN) 2
Lebanon (LB) 2
Saint Vincent and the Grenadines (VC) 2
Georgia (GE) 2
Jordan (JO) 1
Zimbabwe (ZW) 1
Libyan Arab Jamahiriya (LY) 1
Macau (MO) 1
Namibia (NA) 1
Dominican Republic (DO) 1
Faroe Islands (FO) 1
Turks and Caicos Islands (TC) 1
Cuba (CU) 1
Cayman Islands (KY) 1
Haiti (HT) 1
Antigua and Barbuda (AG) 1
Rwanda (RW) 1
Algeria (DZ) 1
Guyana (GY) 1
Turkmenistan (TM) 1
Senegal (SN) 1
Ethiopia (ET) 1
Guatemala (GT) 1
Malta (MT) 1
Grenada (GD) 1
Luxembourg (LU) 1
Afghanistan (AF) 1
Asia/Pacific Region (AP) 1
Suriname (SR) 1
Monaco (MC) 1
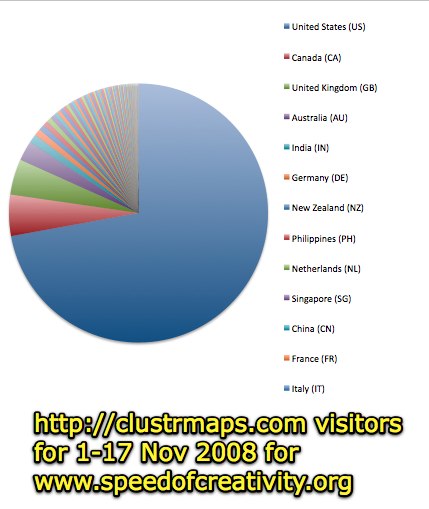
This data pastes nicely and directly into Excel, which can readily generate a pie chart like the following:
Again, this represents a visually different way of viewing visitor data which can be more insightful and meaningful than simply viewing tabular data. Data visualization is VERY important in lots of contexts. Visual literacy is important to understand, and I think we need to spend more time helping and encouraging students to cultivate their own skills of expression and communication with visual media.
If you are not already, consider using ClustrMaps and Feedjit on your classroom website, wiki, or blog page to track visitors. Periodically challenge students to visually represent and explain the data included in these sites in a variety of ways. Using these sites can not only potentially foster greater interest and excitement in web publishing, it can also provide good teachable moments for geography, graphing, and data visualization strategies important for 21st century learners to understand both as content consumers as well as media creators.
Technorati Tags:
visualizing, clustrmap, feedjit, clustrmaps, geography, visitor, website
If you enjoyed this post and found it useful, subscribe to Wes’ free newsletter. Check out Wes’ video tutorial library, “Playing with Media.” Information about more ways to learn with Dr. Wesley Fryer are available on wesfryer.com/after.
On this day..
- Our Daughter Plays Minecraft with International YouTubers – 2015
- Use an Older Wii Remote with Smoothboard Software – 2014
- Small Museums, Libraries and Archives: Advocating to Preserve Community Heritage – 2013
- Advocating for Balanced Content Filtering in Oklahoma City Public Schools – 2011
- Help Needed from Urban Educators: Are Evernote, GDocs & Edmodo Blocked for Your Students? – 2011
- Cloud computing for Microsoft, Persistent requests for IT, and 3 screen strategies – 2010
- Going Mobile with Digital Storytelling – 2010
- Doubting the power of Netbooks? Consider Chrome OS – 2009
- Pleased with Windows 7 default scanning functionality – 2009
- My iMovie to Final Cut learning journey continues – 2008


Comments
2 responses to “Website visitor tracking with Feedjit and ClustrMaps”
Thanks (again) Wesley, for the great comments and ideas about using ClustrMaps.
You even beat us to the announcement… we have not yet rolled out the ‘country totals features’ across all of our servers (so not everyone will have it yet, and when it appears the full totals may not yet be finished until the subsequent map update). Stay tuned for a full announcement in the next few days!
All the best…
-CJ on behalf of the ClustrMaps Team
Can you suggest any other traffic stats tracker just like Feedjit as it shows the search term in google.